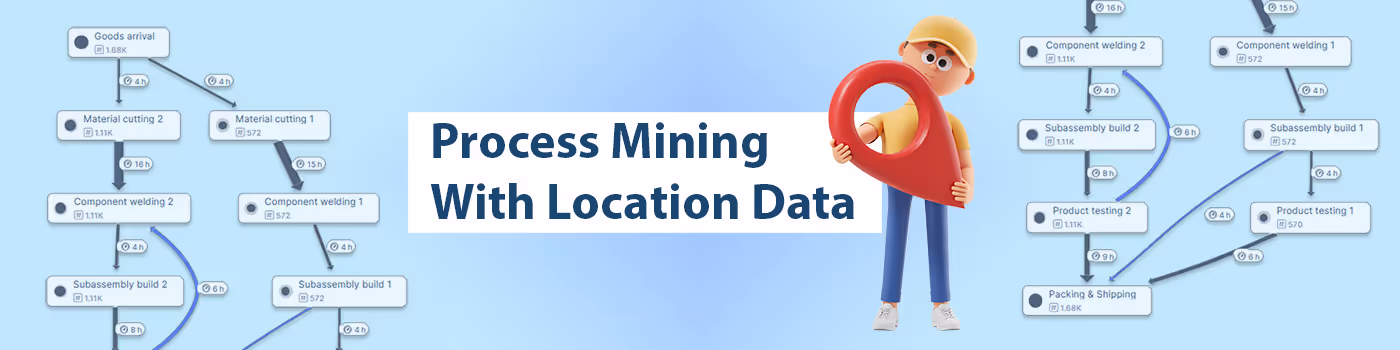
Process Mining Example with Location Data

Introduction
Process mining is a powerful technique used to analyze, monitor, and improve business processes by extracting insights from event logs generated by information systems. By examining data recorded during daily operations — such as timestamps, activity names, case IDs, and users — process mining can visualize how processes actually run in practice, uncovering inefficiencies, deviations, and bottlenecks that might otherwise go unnoticed.
Process mining is widely applied across industries including logistics, healthcare, finance, and manufacturing. In logistics, it can optimize warehouse operations, track shipment flows, and improve delivery reliability. In healthcare, it helps hospitals and clinics analyze patient journeys, reduce waiting times, and streamline treatment processes. Financial institutions use it to ensure regulatory compliance, detect process anomalies, and enhance customer onboarding workflows. In manufacturing, it offers valuable insights into production line performance, identifies delays in quality control, and highlights opportunities to balance workloads or reduce throughput times.
By making operational processes transparent, process mining enables organizations to move beyond assumptions and rely on actual data to drive process improvements, compliance checks, and strategic decision-making.
In this blog post, we walk through a concrete process mining example based on indoor location data from a real manufacturing flow. Using event logs generated from RTLS data, we demonstrate how to visualize, validate, and optimize processes using tools like Celonis, IBM Process Mining, and PM4Py in Python. You can download the example dataset and scripts here to follow along or try it with your own tools:
Benefits and Advantages of Process Mining
Before we delve into the example, let's first introduce the three main categories of process mining:
1. Process Discovery
What it does: Automatically creates a process model based on real event log data.Benefits:
- Reveals how processes actually run, including hidden paths and variations.
- No need for pre-existing models — it builds them from data.
- Helps organizations visualize operational reality vs. expectations.
2. Conformance Checking
What it does: Compares the actual process (from logs) with an existing reference model.
- Detects deviations, inefficiencies, and compliance issues.
- Supports auditing and regulatory checks.
- Highlights areas where processes diverge from standard procedures.
3. Process Enhancement
What it does: Improves existing process models using real data insights.
- Identifies bottlenecks, delays, and opportunities for optimization.
- Fine-tunes processes based on operational performance.
- Supports continuous process improvement and decision-making.
In the following sections, we’ll demonstrate how users can apply existing process mining tools to leverage indoor location data and event logs to investigate these three categories within their own processes.
Adding Location Data to Traditional Process Mining
How Event Logs Are Typically Captured
In most process mining use cases, event logs come from enterprise systems like ERP, MES, or WMS. These systems generate logs when a user performs a digital action — such as scanning a barcode, confirming an order, or completing a task. Each log contains three key elements: a case ID, an activity name, and a timestamp.
This works well for digital workflows, but falls short when key process steps happen in the physical world — like moving goods through a factory or transferring patients in a hospital.
How Location Data Enhances Process Mining
By using real-time location data with geofencing, it’s possible to automatically log events based on physical movement. For example:
- A pallet entering a production zone triggers “Start Production”
- A forklift arriving at the shipping area triggers “Ready for Shipment”
This method generates fully structured event logs without manual input — making it ideal for manufacturing, logistics, or healthcare, where many process steps aren’t digitally tracked.
Advantages of this approach:
- Captures real-world actions missed by software logs
- Automates logging without worker interaction
- Reflects actual process flow, not just planned flow
Adding location-based data bridges the gap between physical operations and process mining, enabling more complete and accurate process analysis.
Discover the Pozyx Platform
The Pozyx Platform brings indoor and outdoor positioning data together to provide full asset visibility, automation and location-based insights for logistics and manufacturing.
Pozyx PlatformHow the Pozyx Plaform Provides the Data for Process Mining
The example we will discuss is from a manufacturing facility with two production lines. Each job needs to pass through different locations in the facility before it is ready for shipment to the customer.
The customer wants to gain automatic insight in his production process. To achieve this, each job in the facility will be tracked.
Real-Time Job Tracking Through UWB Technology
To achieve this tracking, the jobs that flow through the process are tracked by UWB tags. These trackers allow for accurate tracking of the jobs, and helps us determine how much time the jobs spends in a certain location which is defined by a geofence on the map.
This task is something that can be handled by the Pozyx UWB Real Time Location System (RTLS). This product delivers the required hardware (tags and anchors), and the positioning server that delivers real-time positioning updates of each job.
From Position Data to Event Logs: The Role of the Pozyx Platform
The positions coming from the RTLS can be easily handled by the Pozyx Platform. The Pozyx platform allows users to add business logic to the location data. More specifically, a user can configure a process within the platform that defines when a job starts and finishes. Once this is set up, the Pozyx Platform will generate an event stream that tracks each job and its location history.

It’s important to note that while the Pozyx Platform integrates seamlessly with the Pozyx UWB RTLS, it isn’t limited to it. Any accurate RTLS system capable of providing reliable position updates can be connected to the Pozyx Platform to unlock the capabilities that follow.
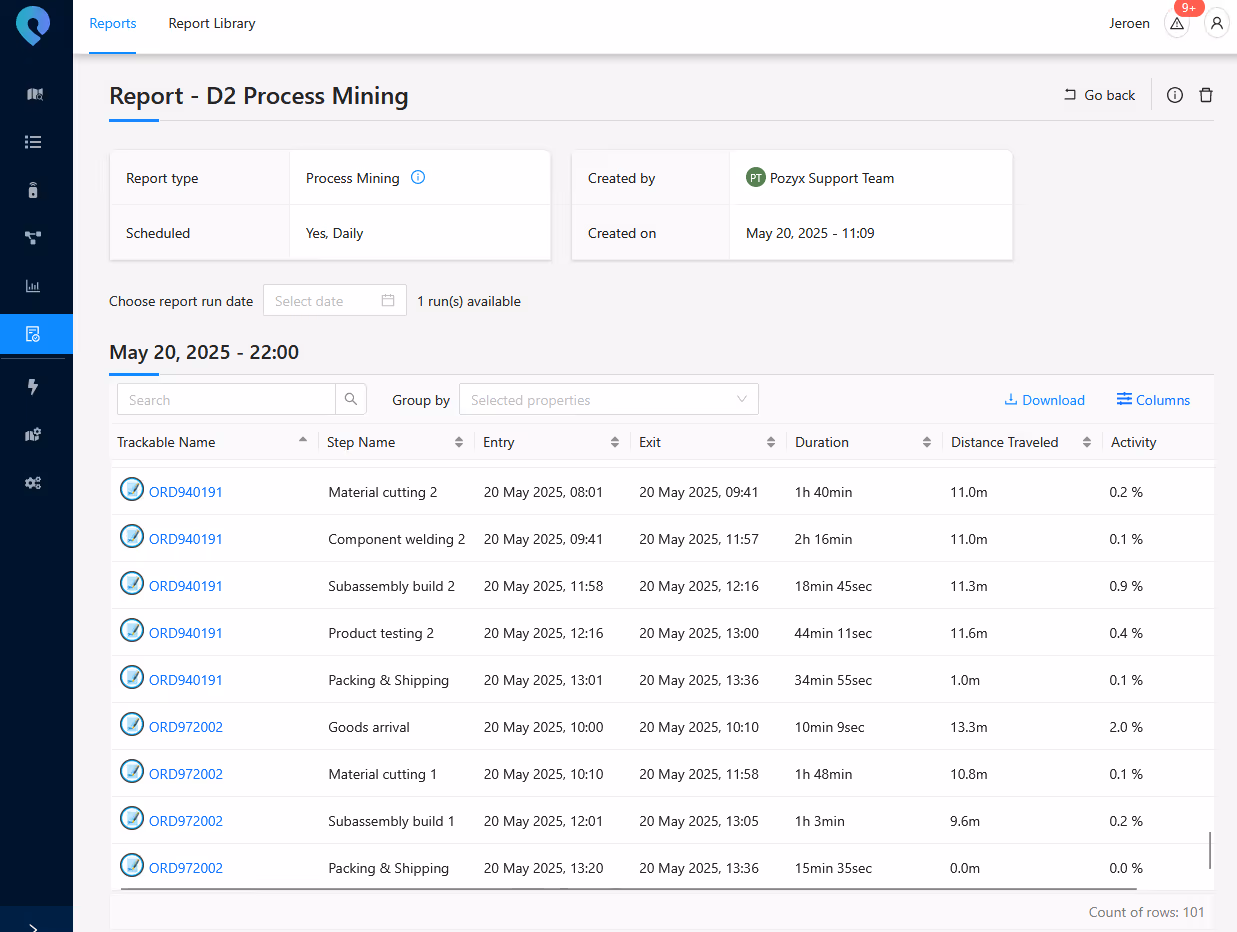
Once the setup is complete, the easiest way to move forward is by using our reporting tool to automatically generate a process mining report. This report, delivered as an Excel or CSV file, can then be imported into dedicated process mining tools for further analysis.
Analyzing the process mining example
We will now illustrate some basic process mining techniques using some well known tools for process mining.
First look at our process with Celonis Business Miner
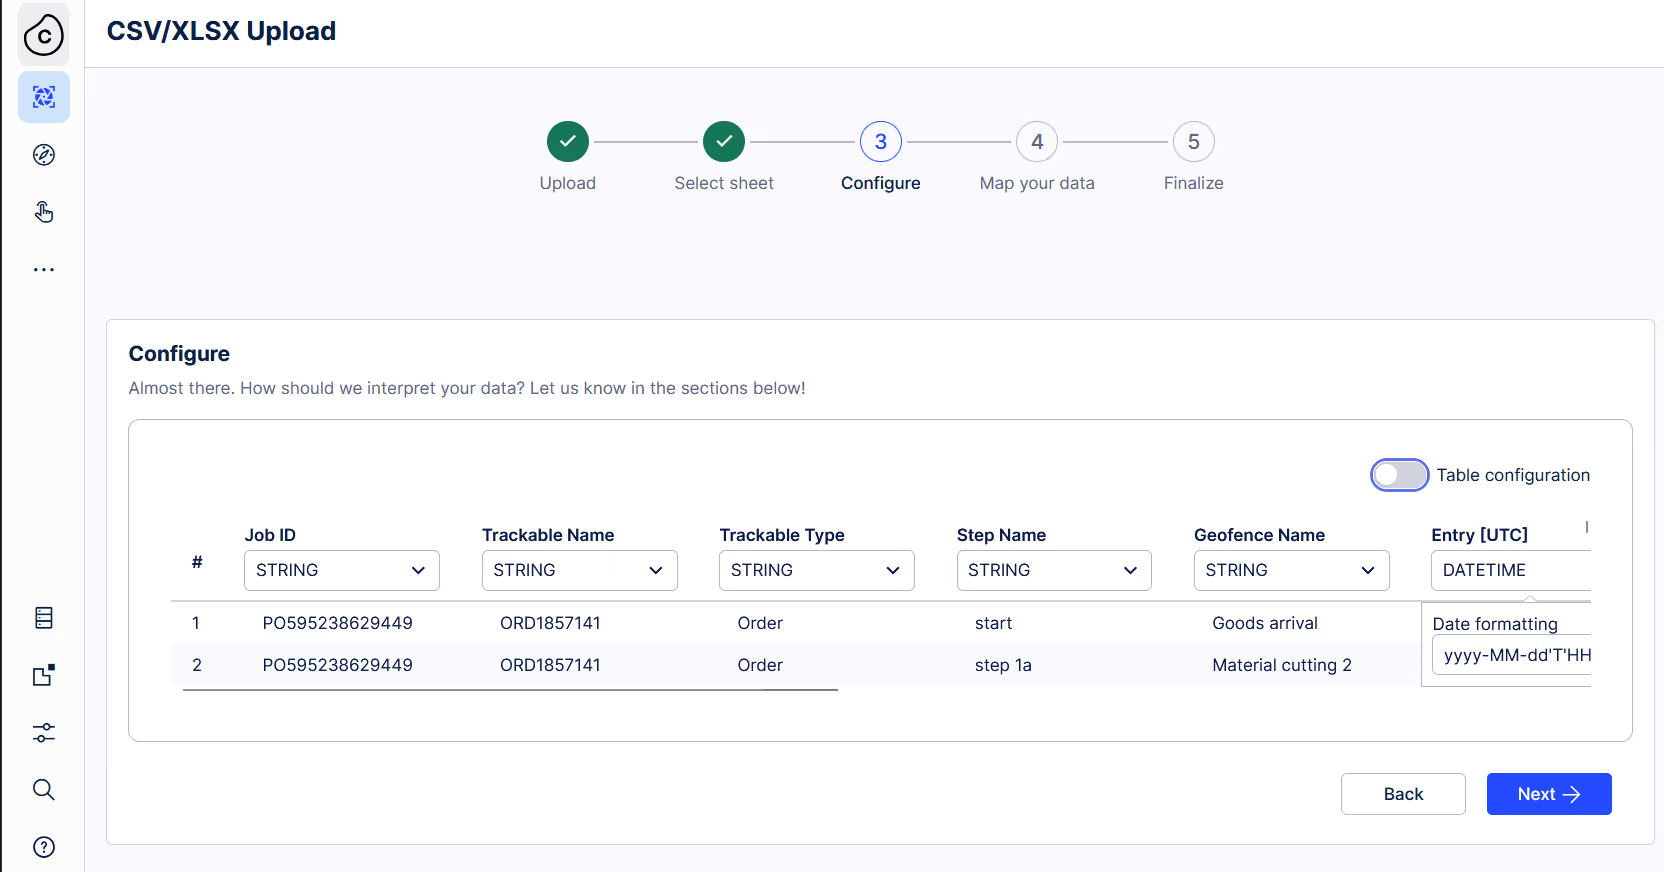
We will first load our report in to the process mining application of Celonis.
First, we will upload our CSV or Excel file containing the event log. Once uploaded, we can configure the application to recognize which columns contain the key information: timestamp, activity name, and case ID.
Using their process explorer, it is quite easy to visualize the process we have tracked with the RTLS system.
The explorer then provides the user with a direct overview of the various aspects it can analyze in more detail.
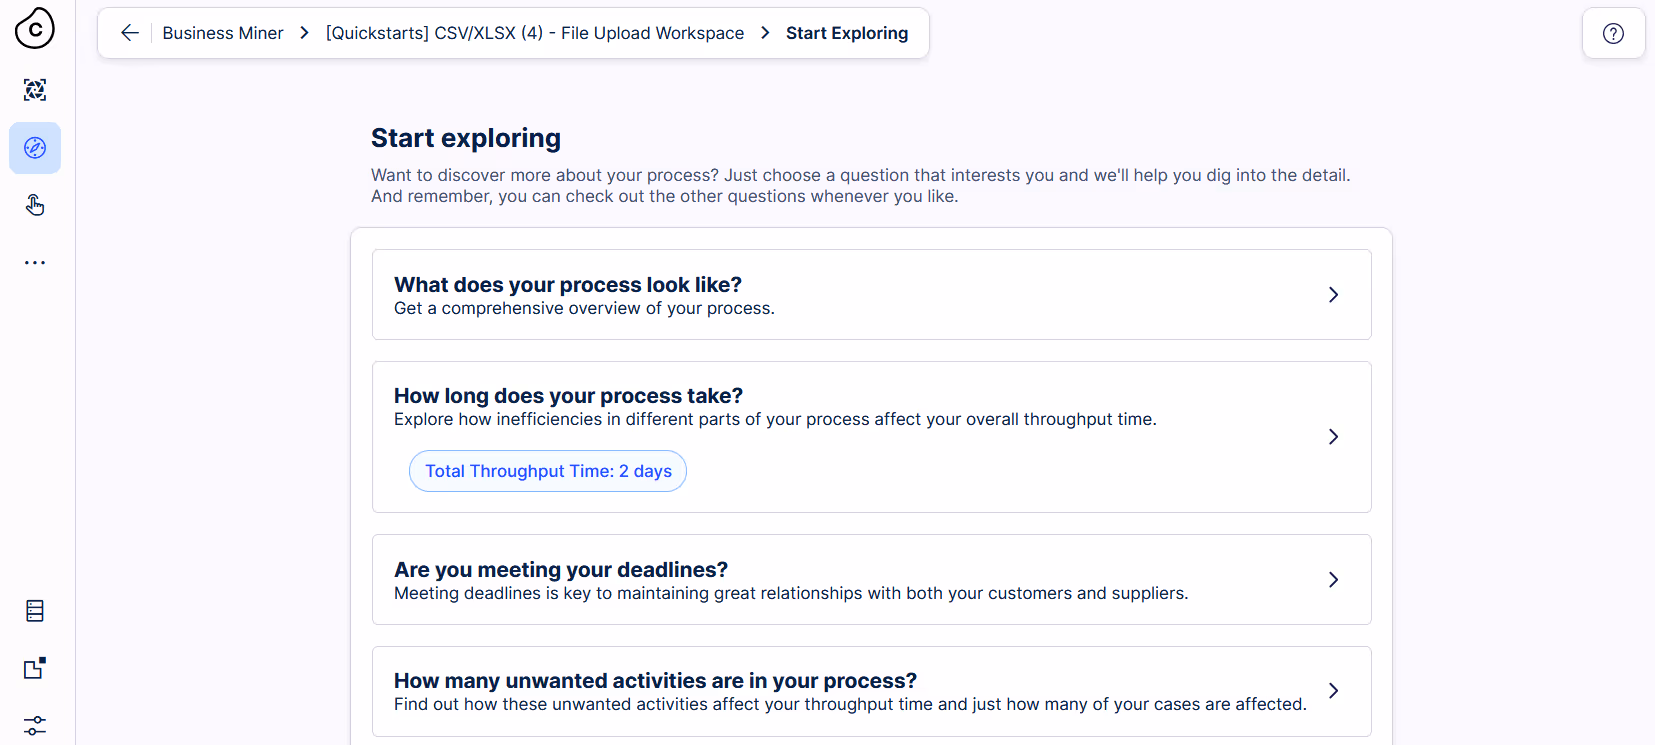
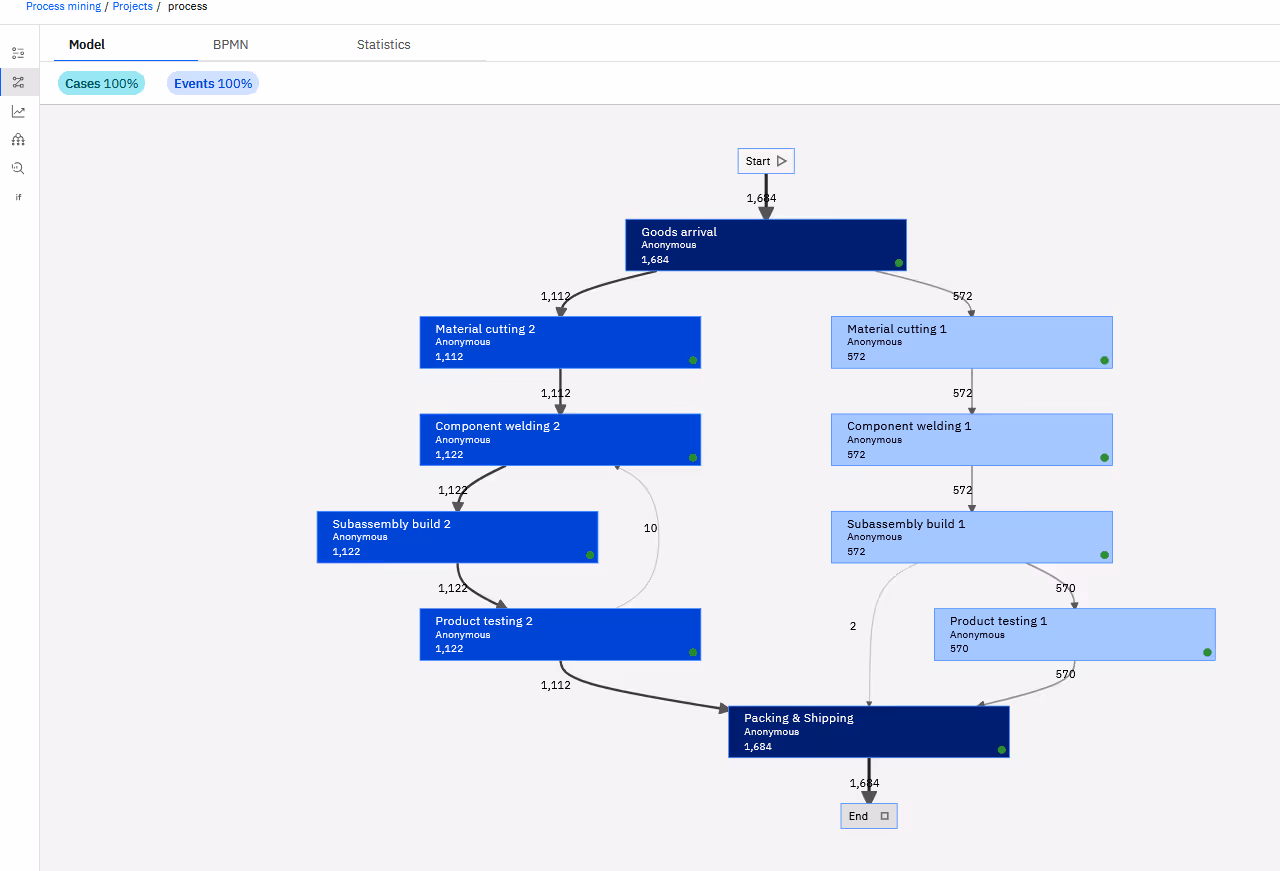
The first thing we will explore is the question: "What does your process look like?" This ties into the process discovery and allows the user to visualize their process.
From this, we clearly see that orders start with the task Goods arrival, and then continue in one of two production lines.
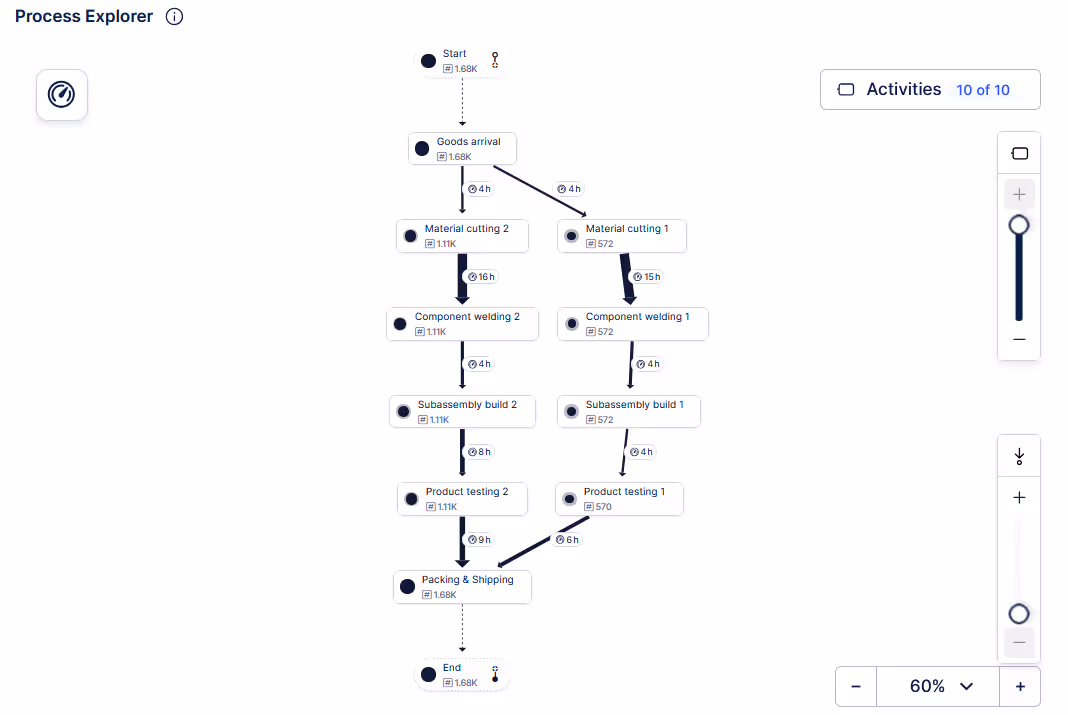
The process concludes after the order leaves the Packing & Shipping location.
The tool further provides us with sliders that can be used to filter out less common paths. When we display all paths, two additional ones become visible.
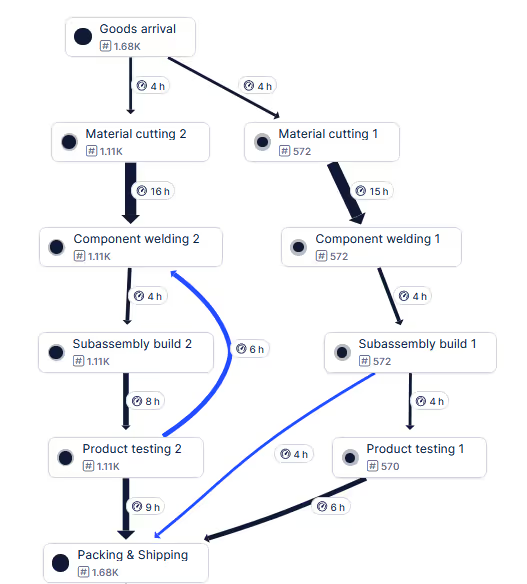
The identification of these two paths is an example of conformance checking. By investigating this view, we notice that the process flow was occasionally not followed.
In the first deviation, we observe that on the first production line, the testing step was skipped for several jobs. This likely indicates a potential quality issue on that production line.
In the second deviation, we see that some products were sent back to a previous step after product testing. This suggests that certain finished products encountered problems during testing and needed rework.
These first steps already quickly show us the benefits and the value of using a process mining tool to further analyze the data. Based on the event log alone, we were able to visualize our process as it runs in the factory and it let us validate the process conformance.
Let’s now dive deeper into the third technique: Process Enhancement.
We’ll start a new exploration called "How long does your process take?"
In this exploration, the tool analyzes the throughput time of our process. It reveals that 1.68K cases have been investigated, with 94% of these cases having a throughput time of three days or less.
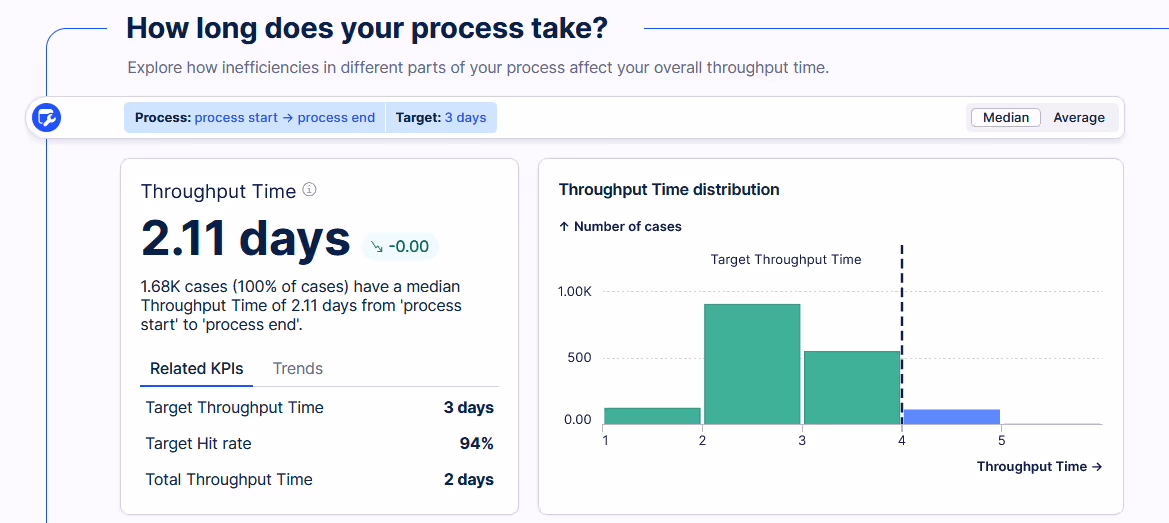
This kind of overview is incredibly useful, as it immediately provides insight into the current expected throughput time. It also translates into an easy-to-track KPI for the facility, as the user can adjust the expected throughput time and instantly see how the current distribution compares.
Additionally, the tool enables users to perform a deeper analysis, allowing them to track the evolution of throughput time over time — identifying trends, anomalies, or periods of improvement and delay.
It is also possible to further delve into the throughput time between tasks, and to see the number of cases per day, but this already gave a good first idea of what is possible with this tool.
Delving into the throughput and wait times with IBM Process Mining
With IBM Process Mining, we follow a very similar workflow to upload our event log into the tool. As before, we need to specify which columns correspond to the Case ID (referred to here as Process ID), activity, and timestamp. A notable distinction, however, is that IBM Process Mining allows us to label two separate columns: one for the start time and another for the end time. This enables the tool to clearly differentiate between the time spent performing an activity and the waiting time between activities — a feature not as readily available in the Celonis Business Miner application.
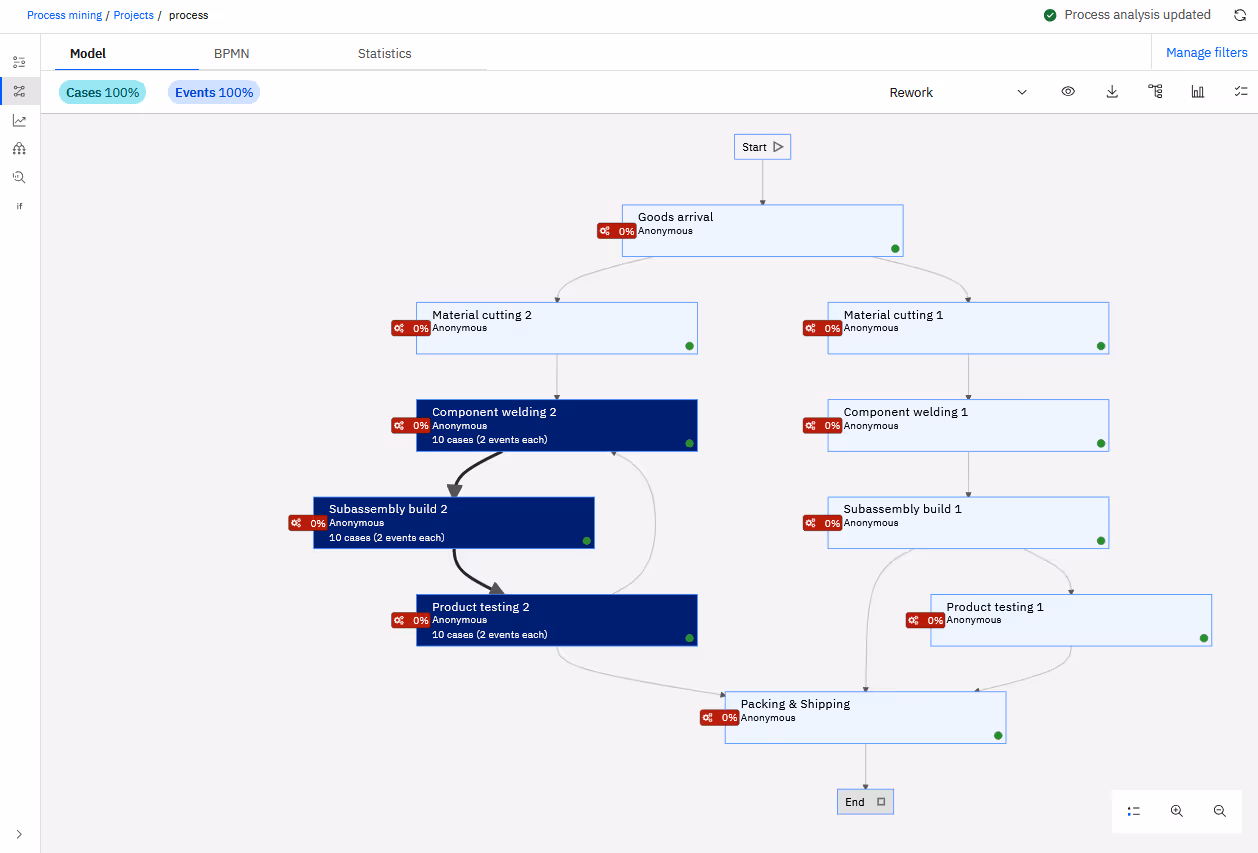
Once the event log is properly configured and labeled, the tool presents its analysis of the process. The visual representation of the process model is quite similar to that of Celonis.
One feature worth highlighting is the ability to select a "Rework" option. Activating this automatically highlights the section of the process previously identified as involving rework. Impressively, the tool performs this variant analysis without requiring any additional input from the user.
Next, we use this tool to explore opportunities for process optimization and enhancement. By examining the analytics, we quickly observe an imbalance in workload between the two production lines: Production Line 2 handles about 65% of all jobs. Additionally, there’s a noticeable difference in throughput times. On average, orders on Production Line 1 are completed in 2 days and 9 hours, compared to 2 days and 16 hours on Production Line 2.
At first glance, this suggests that the facility could improve efficiency by shifting more orders to Production Line 1, which is currently less utilized and has a faster throughput time.
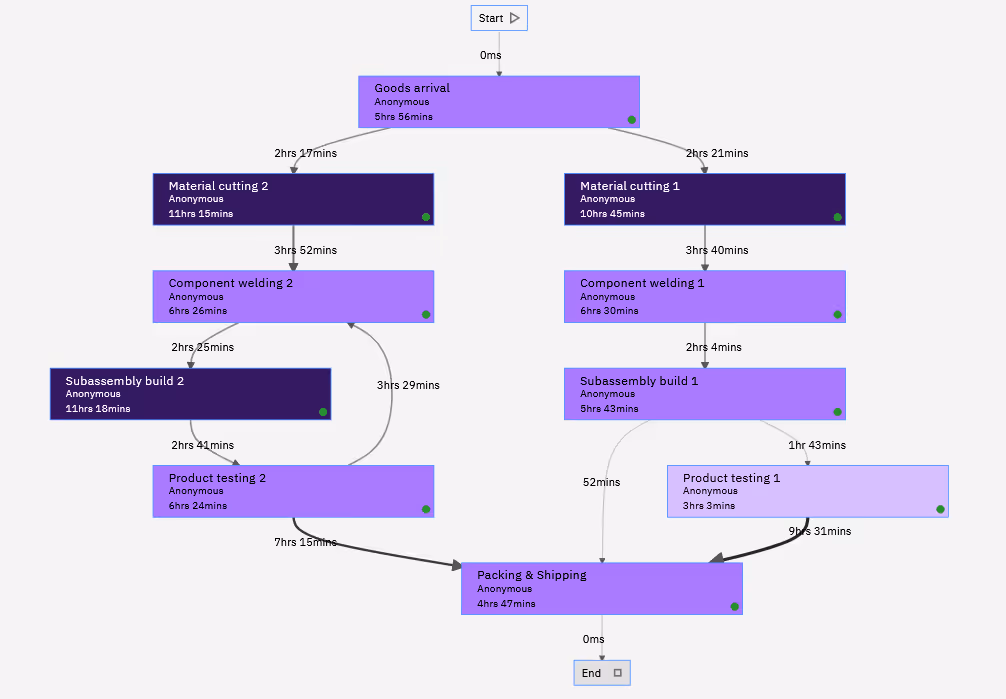
We then examine the process model to review the average duration of each task. As noted earlier, the tool conveniently breaks down each task's duration into two parts: service time and wait time.
The resulting visualization makes it easy to identify these times at every step of the process. Clear differences between the two production lines become apparent, offering further opportunities for optimization upon closer investigation.
Analyzing the event log with Python
As a final step in this analysis, we will look at how we can visualize the event log with Python. To perform process mining in python, we will use the library PM4Py. This library supports state-of-the-art process mining algorithms in Python. In contrast with the previous tools, this tool is open source. However, it has the disadvantage that you will have to do most of the analysis yourself, as there is no user interface to guide you in the data exploration.
We will try to recreate some results that was also found by the previous tools. First, we will import our event log, and will try to get a visualization of our process model.
The way we load the event log is very similar as before:
- We load the event log using pandas, which is a very popular python library for data analysis.
- We label the columns with case ID, activity, start and end timestamp.
We can also quite easily extract the process model from the event log. In one of the basic views it shows us a directed graph from the process with the frequency of each job on the nodes and edges.
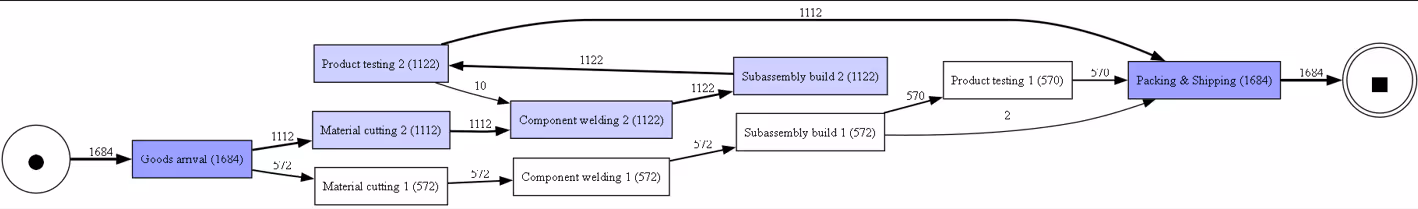
Further analysis is possible, as is an extration of the BPMN model. But we will conclude our overview here. Some of the sample code used to provide this figure can be found in attachment.
Location based insights with RTLS
As can be seen from the example above, location data can generate many different types of insights. While RTLS solutions are often used to analyze asset movements and operational processes inside facilities, other analytics platforms focus on geographic patterns across multiple locations. For example, retailers may analyze store networks to derive customer experience insights across locations, offering another form of location-based insights.
Conclusion
This example highlights the value of process mining when combined with high-quality location data, and how it can uncover actionable insights into operational processes. This example demonstrated how the Pozyx Platform can provide the crucial location-based event log that formed the foundation of the entire analysis.
By accurately tracking the movement of jobs through the production process and converting those location updates into structured event logs, our solution enabled seamless integration with leading process mining tools like Celonis Business Miner, IBM Process Mining, and the open-source PM4Py library in Python. Each tool leveraged the event log we provided to visualize the actual process flows, identify deviations, measure throughput times, and uncover opportunities for optimization.
The results clearly demonstrated the added value of combining location data with process mining techniques — exposing inefficiencies, confirming process conformance, and supporting data-driven decision-making.
While this example focused on a manufacturing use case, the same approach is applicable across industries like logistics, healthcare, and beyond. As a provider of the RTLS infrastructure and event data, we enable our customers to unlock this potential within their own operations.
If you're looking to gain deeper operational insights or optimize your processes, our Pozyx UWB RTLS and Pozyx Platform can serve as the perfect foundation for your next process mining project.
Written by
Jeroen Van Hecke

Senior R&D engineer at Pozyx
Jeroen Van Hecke is a senior R&D engineer at Pozyx, where he focuses on algorithm development and system optimization for real-time location solutions. With a background in electrical engineering and a Ph.D. from Ghent University, he brings both academic rigor and hands-on expertise to industrial innovation.